For this analysis, I was not looking to create a shareable output but was studying the data provided from an ESRI Academy “Lab”. The course had us take a look at weather station data, choose variables suitable for running a regression analysis for predicting temperature and analyze the results.
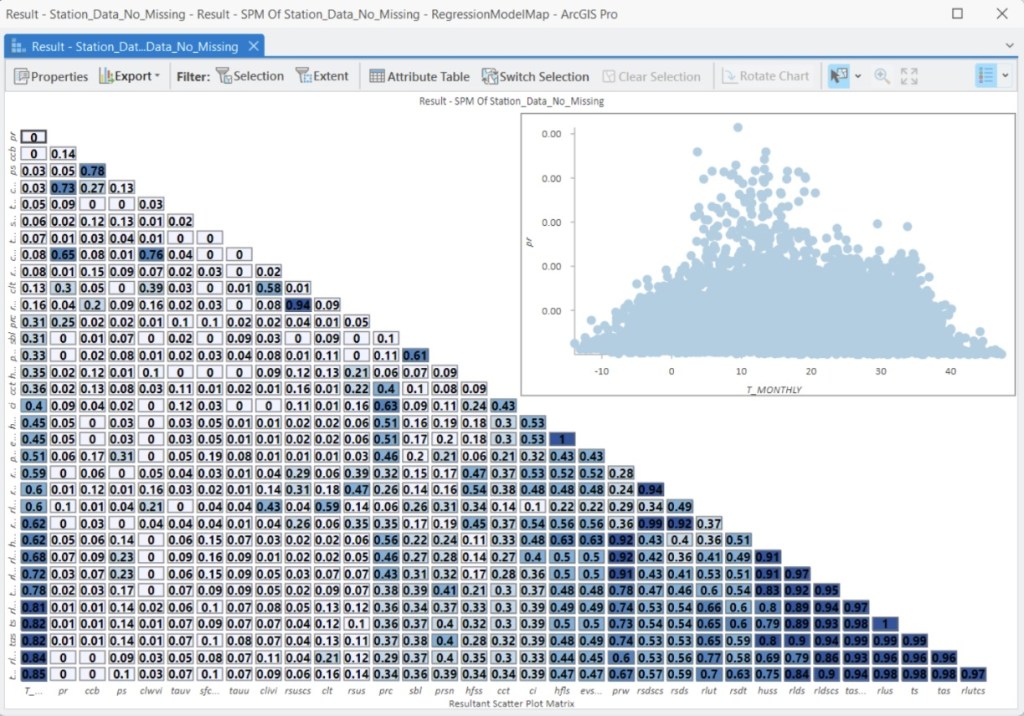
The data was first looked at in a scatter plot matrix to determine variables that were highly dependent on the independent variable (monthly temperature) but not highly correlated with each other.
I then ran a Generalized Linear Regression using a Gaussian model using the Air Pressure at Convective Cloud Top (Pa), Near-Surface Specific Humidity, and TOA Outgoing Longwave Radiation (W m-2) variables.
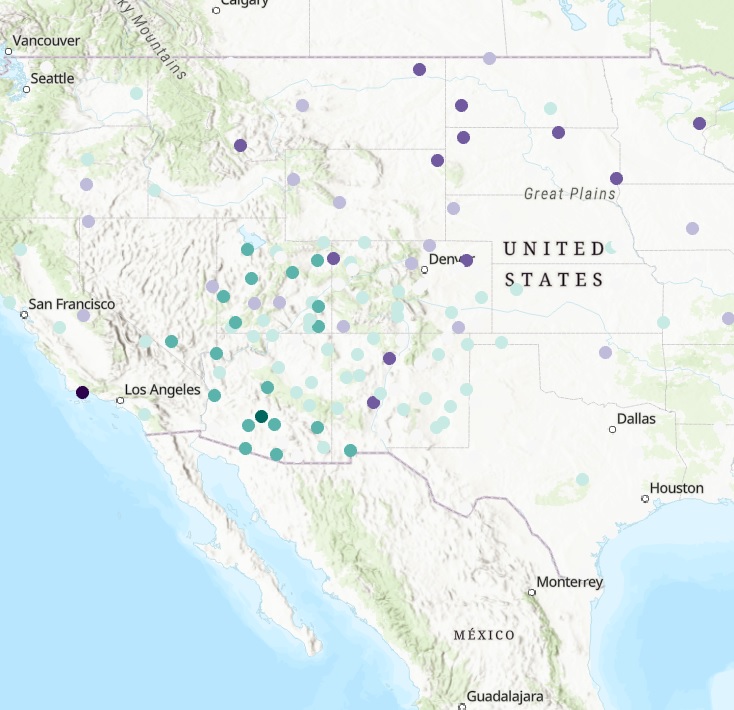
This created a standard deviation map of the stations showing a geographic relationship for stations that have high vs low variability between them, however, I would have liked to have a more even distribution of station locations to truly make a prediction based on this analysis.